
A slow website can frustrate visitors before they even see what you offer. If a page takes too long to load, people may leave without reading your content, exploring your services, or making a purchase. Website performance tools help you find these problems and understand what needs to be improved.
Whether you manage a business website, an online store, or a blog, the right tools can help you measure speed, check user experience, and identify technical issues.
What Are Website Performance Tools?
Website performance tools are applications that measure how a website loads and behaves. They help site owners identify issues that may affect loading speed, usability, and the overall browsing experience.
Depending on the tool, you can check image sizes, JavaScript execution, server response times, layout shifts, and other performance factors.
These tools are useful for:
- Business owners who want a faster website.
- SEO professionals checking technical website issues.
- Developers troubleshooting slow pages.
- Bloggers improving the reading experience.
- E-commerce teams trying to make product pages easier to use.
Some tools provide real-user data, while others simulate visits under controlled conditions. Using both types can give you a clearer understanding of your website’s performance.
1. Google PageSpeed Insights
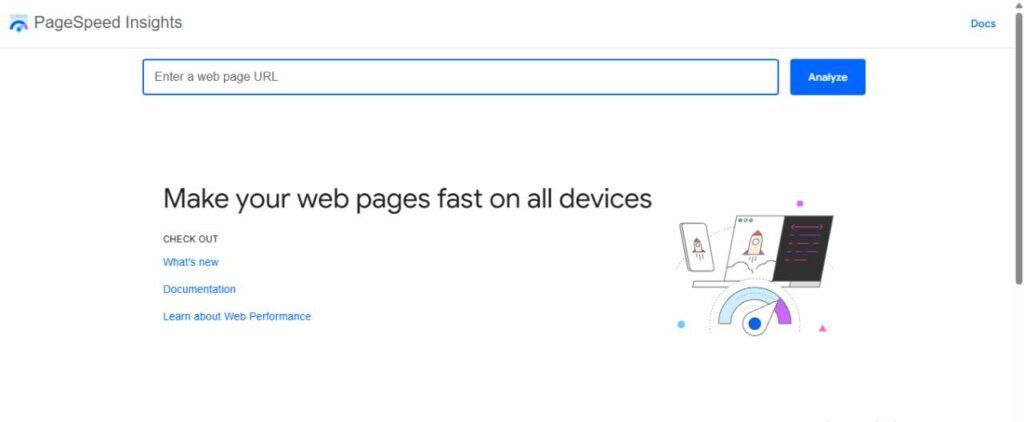
Google PageSpeed Insights is a free tool that analyzes a web page and provides suggestions for improving its performance. It reports lab data from Lighthouse and, when available, real-user field data from the Chrome User Experience Report.
You can enter a page URL to see its performance results on mobile and desktop.
Key features
- Measures performance using a standardized test.
- Reports Largest Contentful Paint (LCP), Interaction to Next Paint (INP), and Cumulative Layout Shift (CLS) when field data is available.
- Highlights opportunities such as image optimization and reducing unnecessary JavaScript.
- Provides separate mobile and desktop reports.
When should you use it?
Start with PageSpeed Insights when you want to understand why a page feels slow. Follow the recommendations that address your biggest issues rather than trying to fix every warning at once.
2. GTmetrix
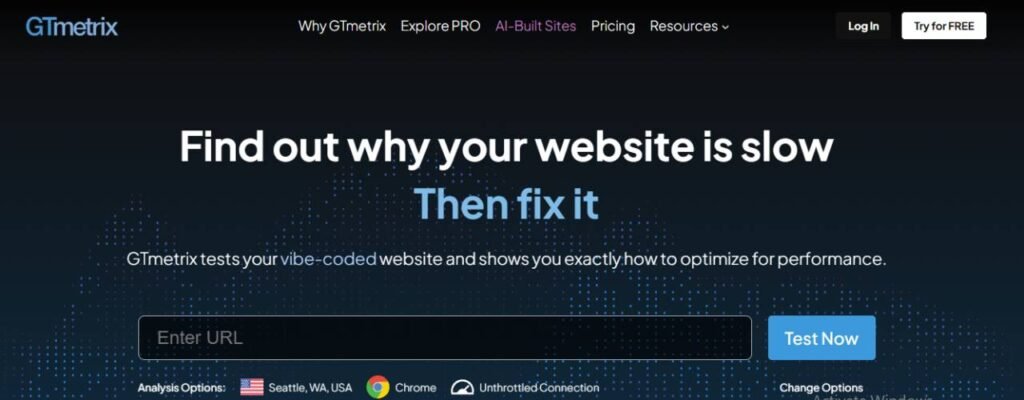
GTmetrix provides website performance reports that help you examine loading time, page size, requests, and the resources a browser loads.
Its waterfall chart is particularly useful because it shows how individual page resources load and where delays occur.
Key features
- Displays loading and performance metrics.
- Helps identify large images and resource-heavy scripts.
- Shows a detailed request waterfall.
- Supports repeat testing to compare changes.
When should you use it?
Use GTmetrix when PageSpeed Insights identifies a problem but you need more detail about the resources causing it. For example, the report may help you investigate a large hero image, a third-party script, or a slow-loading font.
3. Google Search Console
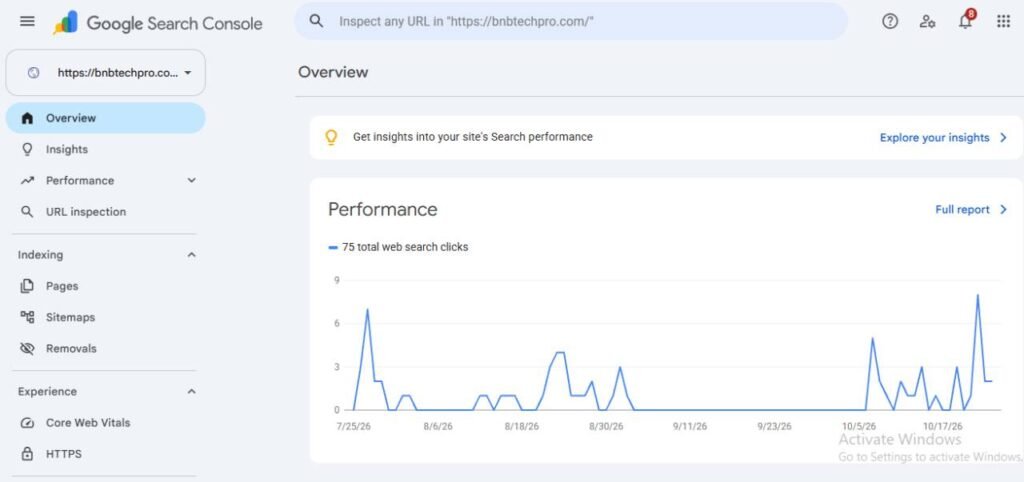
Google Search Console helps website owners understand how their pages perform in Google Search and whether Google has identified certain technical or experience-related issues.
Its Core Web Vitals report groups eligible URLs according to their reported user experience data.
Key features
- Monitors Core Web Vitals using available real-user data.
- Helps identify groups of URLs that need attention.
- Reports indexing and search visibility information.
- Allows you to monitor changes after fixing website issues.
When should you use it?
Use Search Console regularly if organic search traffic matters to your business. It can help you prioritize improvements across multiple pages instead of testing only your homepage.
Remember that Search Console is not a complete speed-testing tool. Pair it with PageSpeed Insights or another performance analyzer for more detailed diagnostics.
4. Lighthouse
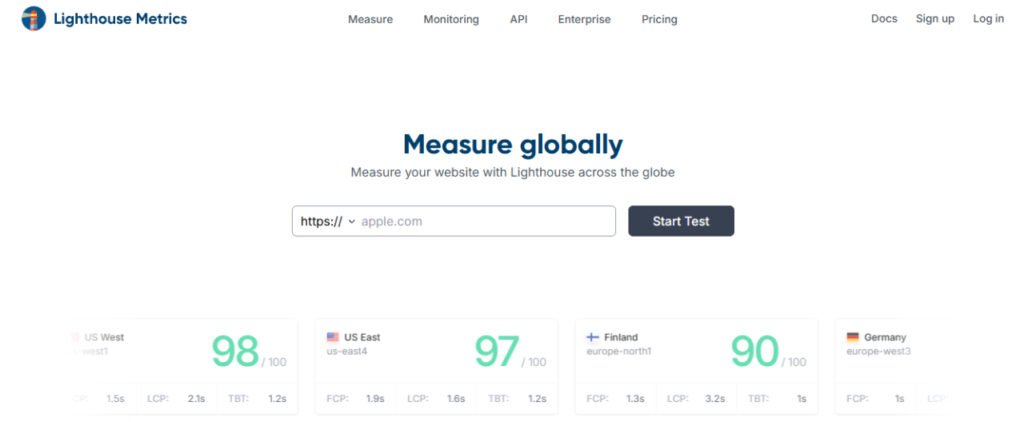
Lighthouse is an open-source auditing tool that can run through Chrome DevTools, the command line, or other supported environments. It generates reports that help developers and site owners evaluate different aspects of a web page.
Key features
- Audits performance and loading behavior.
- Checks accessibility and selected best practices.
- Includes basic SEO checks.
- Provides diagnostic information and improvement suggestions.
When should you use it?
Run Lighthouse when you need a structured audit of a specific page. It is particularly useful during website development, after a redesign, or when investigating the effects of new scripts and features.
Keep in mind that Lighthouse scores can change between runs because of network conditions, device resources, and other testing factors.
5. WebPageTest
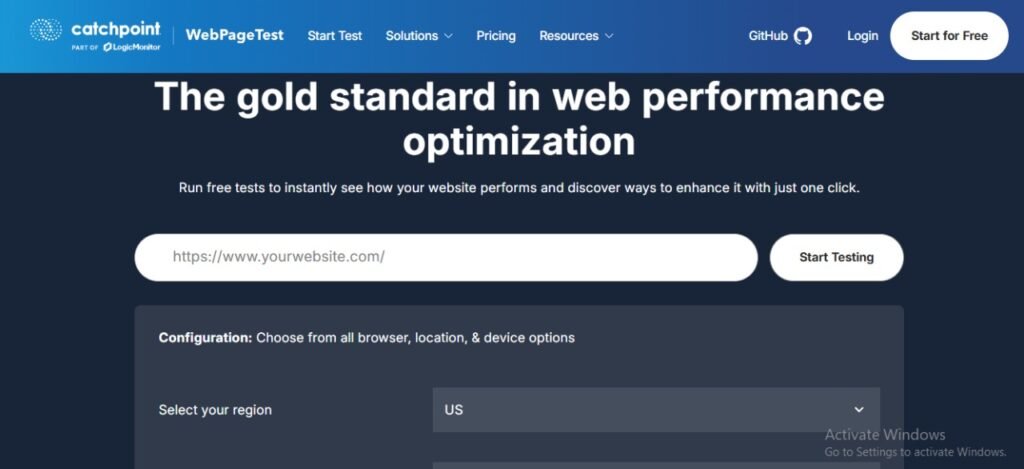
WebPageTest lets you test a page under different conditions, including selected browsers, locations, and connection speeds. This makes it useful for investigating how a website behaves for different audiences.
Key features
- Provides detailed waterfall charts.
- Offers filmstrip views of the loading process.
- Helps analyze performance under different test conditions.
- Supports advanced performance diagnostics.
When should you use it?
Use WebPageTest when you need to investigate a difficult performance problem or compare how a page loads under different network conditions.
For example, if your visitors are spread across the US, Pakistan, and India, testing from relevant locations can help you investigate regional differences. The results are controlled tests, however, and do not automatically represent every visitor’s real experience.
6. Pingdom Website Speed Test
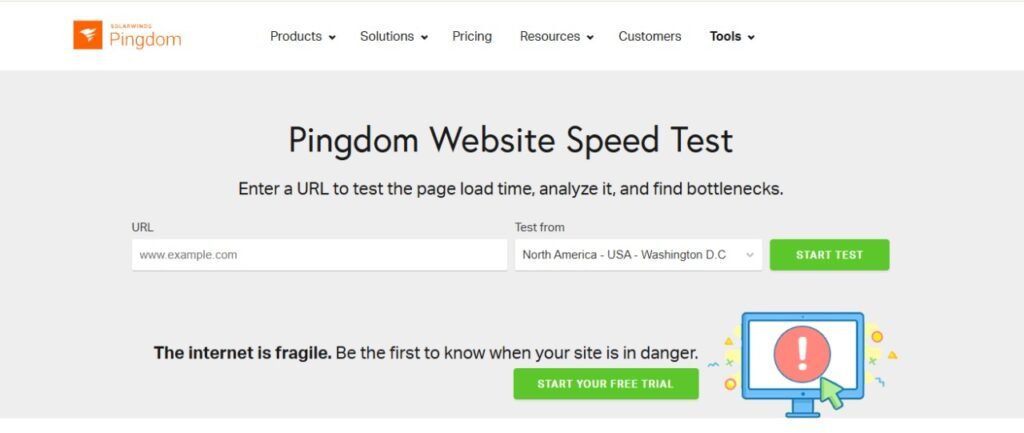
Pingdom’s Website Speed Test provides a straightforward way to inspect how a page loads from a selected test location. Its reports can help you understand page size, requests, and the time required to load resources.
Key features
- Provides an overview of page performance.
- Shows page size and request information.
- Helps identify resources that may need optimization.
- Supports testing from available locations.
When should you use it?
Pingdom is useful for quick checks after changing your theme, installing a plugin, or updating important website content.
Do not rely on a single score as proof that your website is fast for everyone. Compare repeat tests and consider real-user data where available.
7. Chrome DevTools
Chrome DevTools is a set of developer tools built into Google Chrome. Its Performance panel helps you record page activity and investigate how scripts, rendering, and other browser tasks affect responsiveness.
Key features
- Records page activity for detailed analysis.
- Helps identify long-running JavaScript tasks.
- Supports network request inspection.
- Helps developers investigate rendering and interaction delays.
When should you use it?
Use Chrome DevTools when a page looks fine in a basic speed report but still feels slow during interaction. It is especially helpful when troubleshooting menus, filters, animations, and other interactive elements.
You do not need to install a separate application to access DevTools in Chrome.
8. DebugBear
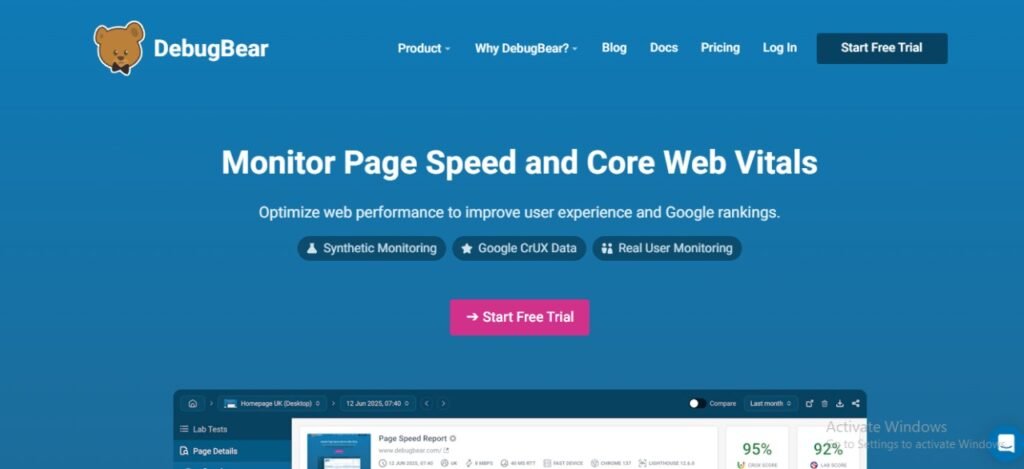
DebugBear provides website performance monitoring and analysis features designed to help teams track changes and investigate performance problems over time.
Depending on the plan and configuration, it can combine lab testing, performance monitoring, and real-user measurements.
Key features
- Helps track performance changes.
- Provides detailed performance diagnostics.
- Supports monitoring workflows for websites and teams.
- Helps investigate regressions after website updates.
When should you use it?
Consider DebugBear if you manage a business website that changes frequently or need to monitor performance across several pages.
For a small website, occasional testing with free tools may be enough. A dedicated monitoring platform becomes more useful when you need regular reports and alerts.
9. Semrush Site Audit
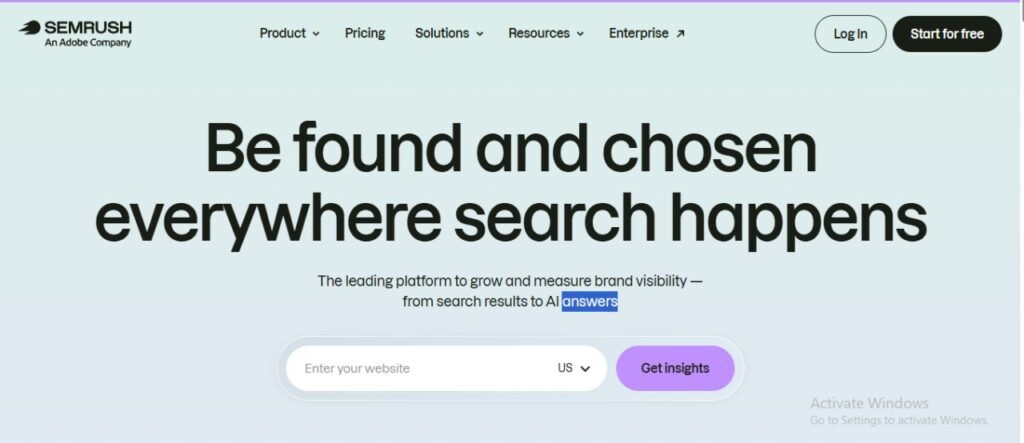
Semrush Site Audit crawls a website and checks for a range of technical and on-page SEO issues. It is not a replacement for a dedicated speed test, but it can complement performance analysis by highlighting problems that affect site health.
Key features
- Crawls website pages to identify technical issues.
- Helps find broken links and crawlability problems.
- Checks selected on-page SEO factors.
- Helps teams organize and prioritize audit findings.
When should you use it?
Use Semrush Site Audit when you want to review technical SEO issues across your website rather than investigate only one page’s loading speed.
Combine it with PageSpeed Insights or GTmetrix to examine performance metrics in more detail. Access to Semrush’s audit features depends on the available plan.
10. YSlow
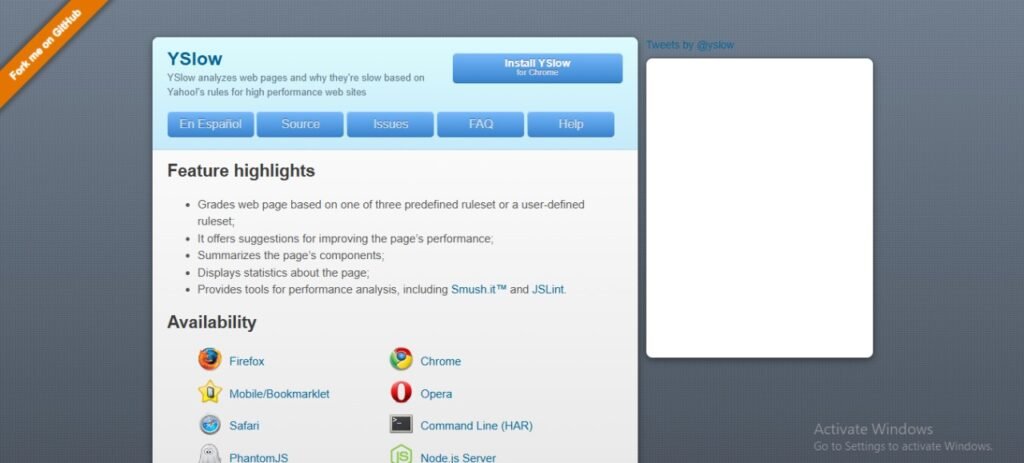
YSlow is a legacy website performance analysis tool based on older performance rules. It was designed to help users evaluate factors such as HTTP requests, caching, and page structure.
Key features
- Introduced rule-based performance analysis.
- Helped identify certain page-loading inefficiencies.
- Encouraged improvements to caching and resource delivery.
Should you use YSlow today?
YSlow is included here for historical context, not as a recommended tool for a new performance-testing workflow. It is outdated compared with modern tools and should not be relied on for current Core Web Vitals analysis.
For practical website optimization today, use PageSpeed Insights, Lighthouse, Chrome DevTools, or WebPageTest instead.
How to Choose the Right Website Performance Tools
The best tool depends on what you need to measure. You do not have to use every tool on this list to improve your website.
| Your goal | Recommended tool |
| Check speed and Core Web Vitals | PageSpeed Insights |
| Find slow-loading resources | GTmetrix |
| Monitor search and URL experience issues | Google Search Console |
| Audit performance and accessibility | Lighthouse |
| Test different locations and networks | WebPageTest |
| Inspect browser activity | Chrome DevTools |
| Monitor performance over time | DebugBear |
| Audit technical SEO issues | Semrush Site Audit |
For most small business websites, start with Google PageSpeed Insights and Google Search Console. Add GTmetrix or Chrome DevTools when you need more detailed troubleshooting.
How to Improve Website Performance After Testing
Website performance is an important part of technical SEO because it affects how visitors experience your website. If you want to learn the basics of search engine optimization, read our guide on What Is SEO?. It explains on-page SEO, off-page SEO, and technical SEO in simple terms.
Optimize large images
Large images can increase page weight and slow down loading. Resize images to suitable dimensions, compress them, and consider modern formats such as WebP or AVIF where appropriate.
Reduce unnecessary JavaScript
Excessive scripts can delay page rendering and user interactions. Remove unused code where possible and review third-party scripts that are not essential.
Improve caching
Browser caching and appropriate server-side caching can reduce repeated work when visitors return to your site. The best setup depends on your hosting environment and website platform.
Review hosting and server response
If your server responds slowly, investigate hosting resources, database performance, caching, and server configuration. A new theme or image compression alone may not resolve server-side delays.
Check Core Web Vitals
Google’s Core Web Vitals measure three important aspects of user experience:
- LCP (Largest Contentful Paint): How quickly the main content appears. A good result is 2.5 seconds or less.
- INP (Interaction to Next Paint): How quickly the page responds to user interactions. A good result is 200 milliseconds or less.
- CLS (Cumulative Layout Shift): How much unexpected layout movement occurs. A good result is 0.1 or less.
These thresholds are evaluated at the 75th percentile of page visits, with mobile and desktop considered separately. Use field data where available to understand your visitors’ actual experience.
Conclusion
Website performance is an important part of creating a useful and reliable website. Slow loading, delayed interactions, and unexpected layout changes can make it harder for visitors to use your pages.
For most site owners, Google PageSpeed Insights is the best starting point, while Google Search Console helps monitor real-user Core Web Vitals and search-related issues. GTmetrix and Chrome DevTools can provide more detail when you need to investigate a specific problem.
Choose tools based on your goals, fix the most important issues first, and test again after making changes. A consistent approach is more useful than chasing a perfect score.
If you manage a business website, review performance alongside technical SEO, mobile usability, and content quality to build a better experience for both visitors and search engines.
Frequently Asked Questions
Q1. Which website performance tool is best for beginners?
Google PageSpeed Insights is a good starting point because it is free, easy to use, and provides practical recommendations for improving a page.
Q2. Can website performance tools help with SEO?
Yes. They can identify speed, usability, and technical issues that may affect visitors. Page experience is relevant to Google’s ranking systems, but good scores alone do not guarantee higher rankings.
Q3. Are free website performance testing tools available?
Yes. PageSpeed Insights, Google Search Console, Lighthouse, Chrome DevTools, and WebPageTest offer useful testing or diagnostic features without requiring a paid subscription for basic use.
Q4. How frequently should I test my website speed?
Test after major website changes and review performance regularly. For business-critical websites, automated monitoring can help identify regressions sooner.
Q5. Why do website speed test results differ?
Results can vary because of network conditions, server load, test locations, devices, browser settings, and whether the tool uses simulated or real-user data.
Q6. Do I need several website performance tools?
Not necessarily. Start with one or two tools that meet your needs. Add more when you require deeper diagnostics, real-user monitoring, or technical SEO audits.